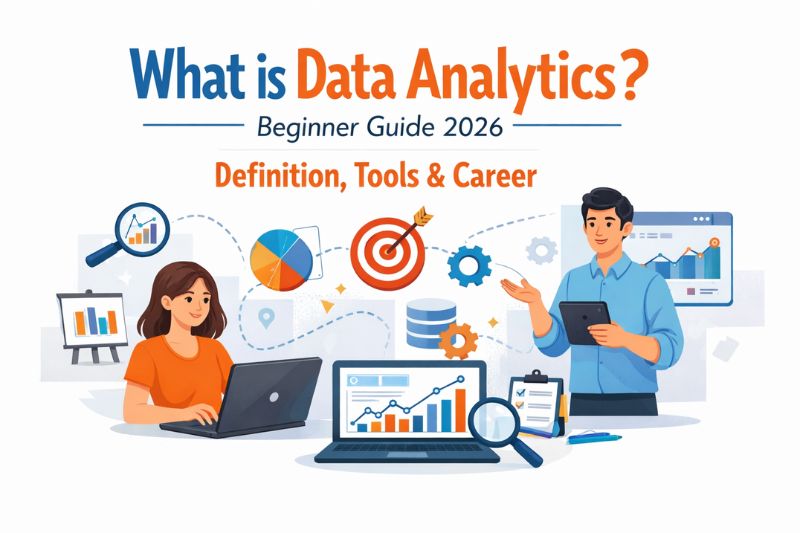
What is Data Analytics? Beginner Guide 2026 Definition, Tools & Career
Have you ever noticed something strange?
You search for a product once.
And then bam, ads for that product are suddenly everywhere.
Or you just you open Netflix, and it knows what you want to watch.
It seems like magic.
But it’s not.
Behind all of this is something very simple — data.
Every click, every search, every purchase creates information.
But that information alone doesn’t do anything.
The value is when someone interprets it.
“Why did you click that ad?”
What type of products are you more attacted to?
What are your favorite products?
What will you do now?
This form of data interpretation is known as data analytics.
And in 2026, it’s not just a technical skill — it’s a career opportunity.
What is Data Analytics?
Data analytics is the science of analyzing raw data in order to make informed decisions. Or when you really want to boil it down:
It means turning raw data into useful information.
Example:
A company has sales data.
Without analytics:
- Just numbers
With analytics:
- Which product is selling more
- Why sales are increasing or decreasing
- What strategy should be used next
Important insight:
Data analytics is not about numbers.
It’s about understanding what those numbers mean.
Why Data Analytics is Important Today
1) Helps in Better Decision Making
Companies don’t rely on guesswork anymore.
They rely on data.
2) Improves Business Performance
Analytics helps:
• Raise sales
• Cut costs
• Enhance customer experience
3) Used in Every Industry
From healthcare to marketing, data information is readily accessible in every aspect of our lives.
“There’s a need for analytics wherever there is data.”
Categories of Data Analytics
Knowing the types will help you to understand how analytics works.
1. Descriptive Analytics
What happened?
Example:
- Monthly sales report
2. Diagnostic Analytics
Why did it happen?
Example:
- Why sales dropped last month
3. Predictive Analytics
What will happen?
Example:
• Estimating sales for the future
4. Prescriptive Analytics
What ought to be done?
Example:
•Recommending business tactics
Most amateurs start with descriptive and diagnostic analyses.
Data Analytics Process (Step-by-Step)
Step 1: Data Collection
Data is gathered from:
- Websites
- Apps
- Databases
Step 2: Data Cleaning
Fixing:
- Errors
- Missing values
- Duplicates
Step 3: Data Analysis
Finding:
- Patterns
- Trends
- Relationships
Step 4: Data Visualization
Creating:
- Charts
- Dashboards
Step 5: Decision Making
Taking action on an insight.
This is how raw data becomes useful.
Tools Used in Data Analytics
Excel
- Data cleaning
- Basic analysis
SQL
- Extract data from databases
Python
- Advanced analysis
- Automation
Power BI / Tableau
- Data visualization
- Dashboards
These tools help at different stages of analysis.
Skills Required for Data Analytics
Technical Skills
- Excel
- SQL
- Python
- Visualization tools
Analytical Skills
- Problem-solving
- Logical thinking
- Data interpretation
Soft Skills
- Communication
- Concern for details
- Application of critical thinking
You need a mix of skills — not just tools.
Career Scope of Data Analytics
Data analysis is a booming career in India.
Industries Hiring:
- IT companies
- Banking
- Healthcare
- E-commerce
- Marketing
Job Roles:
- Data Analyst
- Business Analyst
- BI Analyst
- Data Scientist (advanced)
Positions exist in many different types of companies.
Data Analytics Salary in India
Salary Table
| Experience Level | Salary Range |
| Freshers | ₹3 – ₹6 LPA |
| Mid-Level | ₹7 – ₹15 LPA |
| Experienced | ₹20+ LPA |
Salary grows with skills and experience.
How to Start Learning Data Analytics
Step 1: Learn Basics
Start with Excel and statistics.
Step 2: Learn SQL
Understand how to extract data.
Step 3: Learn Visualization Tools
Create dashboards.
Step 4: Work on Projects
Practice with real datasets.
Step 5: Build Portfolio
Show your work.
This is the path to becoming job-ready.
Future Scope of Data Analytics
Trends:
- Artificial Intelligence
- Big Data
- Cloud computing
- Real-time analytics
Demand will continue to grow.
Challenges in Data Analytics
- Learning multiple tools
- Handling messy data
- High competition
Solution:
Practice + consistency + real projects.
Why Choose Prayug for Data Analytics Learning
If you want to learn data analytics in a structured way, your learning platform matters.
Here’s what helps:
- Practical training (not just theory)
- Industry-relevant tools
- Real-world projects
- Portfolio building
- Interview preparation
Prayug focuses on making you job-ready, not just course-complete.
Conclusion (Hook)
Data analytics isn’t just a skill — it’s a way of thinking.
Asking the right questions is the key.
It’s about getting answers to questions with data.
And it’s about enabling companies to make better decisions.
If you begin in a phased manner and focus on real industry practice then you can make good career in this field.
You’re not supposed to learn everything, all at once.
It’s to start — and get better.
Call to Action:
Prayug: +91 96438 02216
Visit us for more info. - https://prayug.com/live-course/data-analytics-course
Top Blog Posts